

Steps
1
Find the connector
- Dashboard
- API
Open Connectors. The list shows every connection with its integration, type, and when it last linked. Check the counters to identify Active, Incomplete and Relink Needed.
2
Review the sync history
Select the connector and go to Sync. Each run lists its trigger, status, record and employee counts, and when it ends.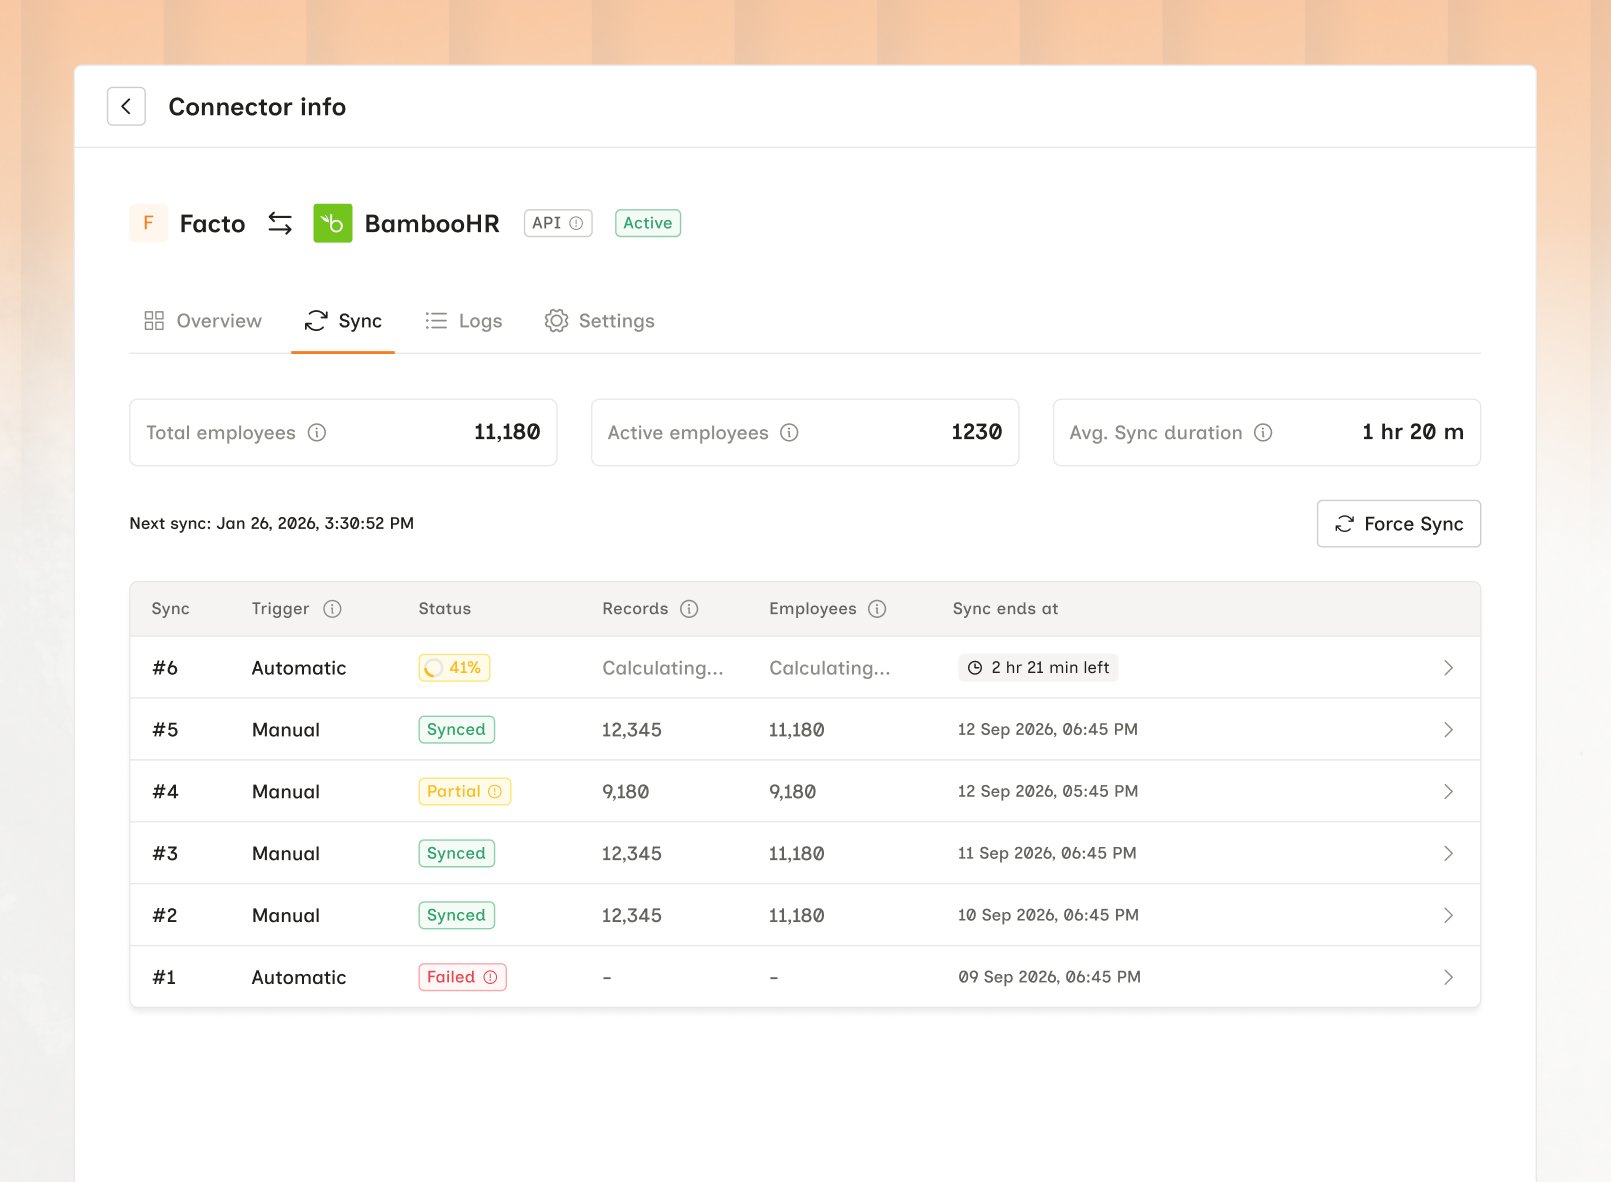
Result: You know which run to open.
3
Read the status on each model
Click into a run to reach Sync info. The header carries the run’s status and duration. Every model the connector covers is listed below with its record count, timings, and status.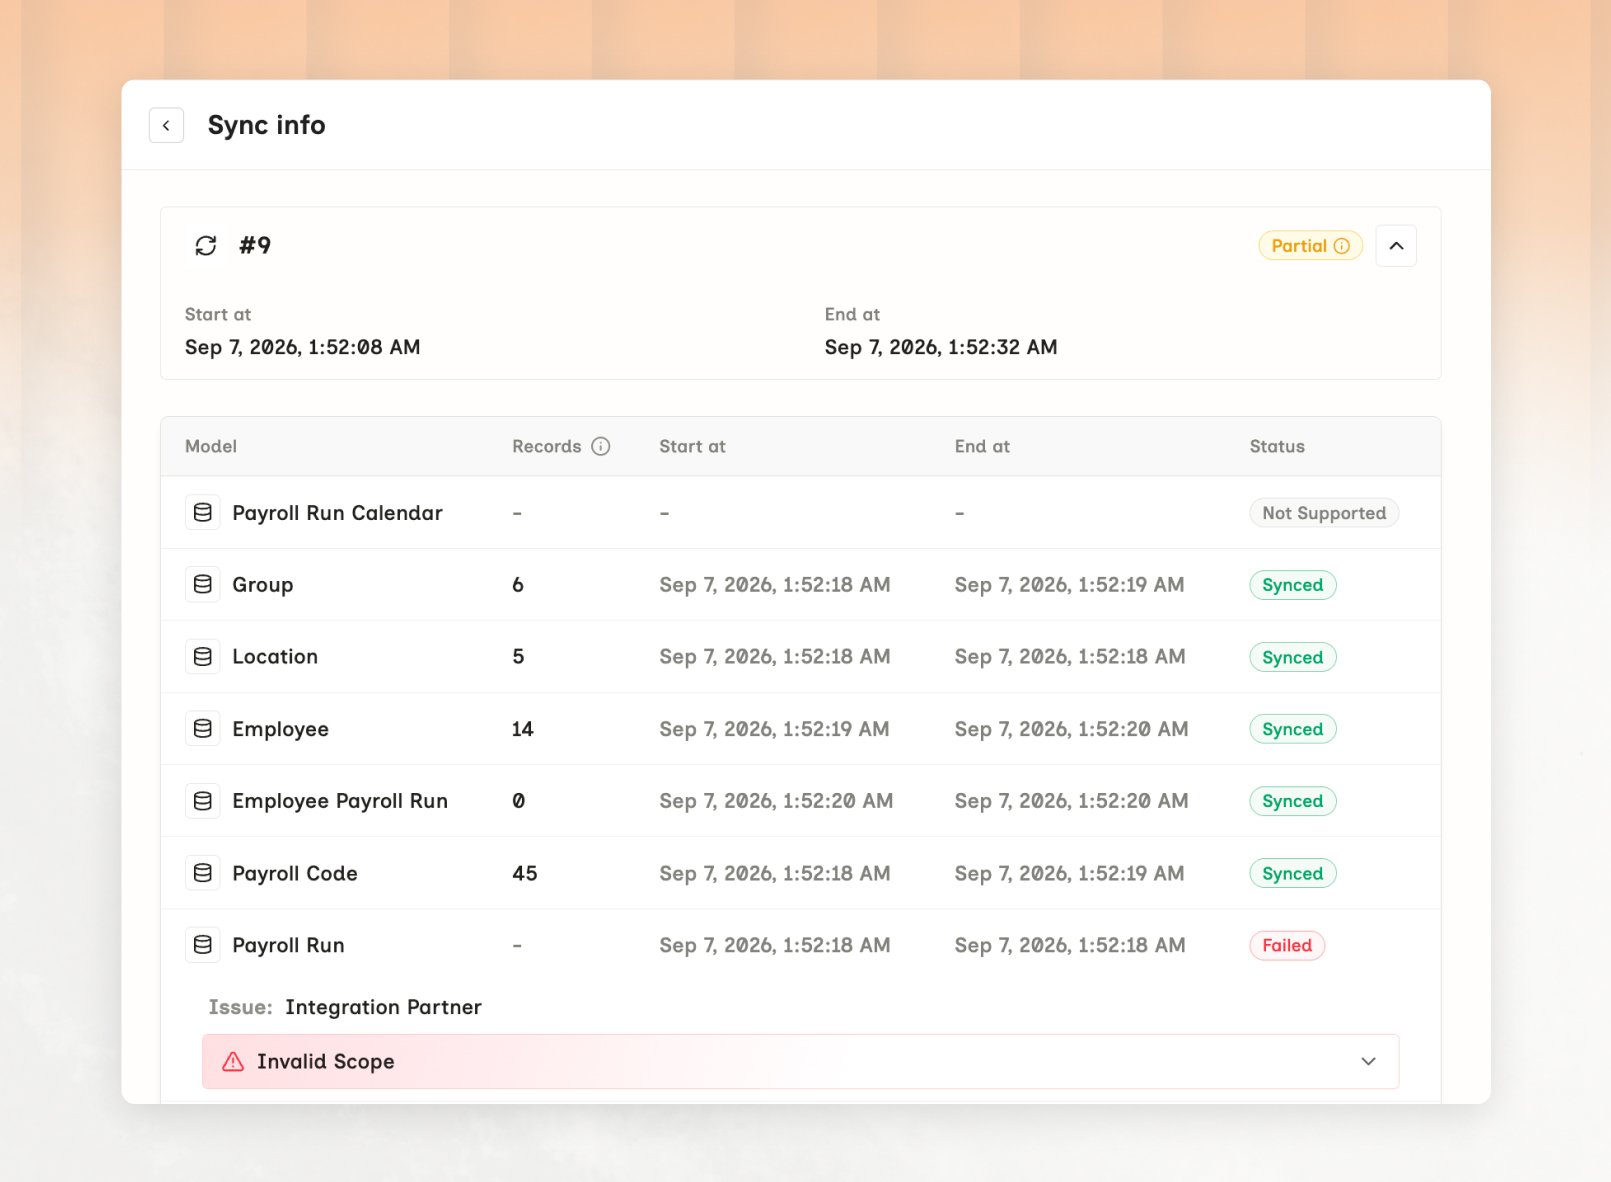
Result: A status for every model. Synced, Skipped and Not Supported all end the investigation here, without reaching Logs. Only Failed continues.
4
Expand a failed model
A Failed row expands in place to name the failure:
Bindbee also flags a recognized cause above the detail - a permission refusal surfaces as Permission issue found!In the run above, Dependent failed with
User not authorized. against Integration Partner - a permission gap on the customer’s side. See Origin-system errors.Result: You know whether to report it to Bindbee or take a permission back to the customer.5
Confirm the timing
Compare the run’s start time against the connector’s configured cadence to work out when the next one is due.Result: You know whether the data you’re reading is current.
Development connectors have no recurring schedule. On one of those, the last sync is
its initial sync or the last one someone triggered - see Syncing.
Diagnose a partial sync
The connector is authenticated and running, so the failure is scoped to specific models. Note every model reporting Failed, then match the set against these patterns. The cause is usually shared across them.Retry the sync
For transient and size-related failures, trigger a fresh run. If the same models fail the same way afterwards, it isn’t transient.- Dashboard
- API
Click Force Sync on the connector’s Overview tab. It grays out while a run is in progress, and on a connector needing re-authorization.
Monitoring this programmatically
Subscribe to webhook events instead of polling.connector.sync.started, connector.sync.completed and connector.sync.failed cover the states above, and connector.relink_needed fires when a connector’s credentials stop working. See Webhook events for the catalog.
The per-model breakdown is dashboard-only. The connector endpoint returns a single
sync_status for the whole run, so these events are the only way to alert on one model.Frequently Asked Questions
A model reads Synced but the data isn't there
A model reads Synced but the data isn't there
Zero records, or records with empty fields. Either the model is out of scope, or the credentials lack permission for that endpoint - see Origin-system errors and Missing records.
The last sync is older than the configured cadence
The last sync is older than the configured cadence
Development connectors don’t auto-sync. On a Production connector this is a stall - see Connector relink.
The sync has been running for a long time
The sync has been running for a long time
Wait for it to finish. Duration scales with population size and with how many API calls the source system makes per record.