> ## Documentation Index
> Fetch the complete documentation index at: https://docs.bindbee.dev/llms.txt
> Use this file to discover all available pages before exploring further.
# Check Sync Status
> Read the per-model breakdown of a connector's last run.
Open the connector and read what its last sync did, model by model. Most data questions are answered here.
## Steps
Open **Connectors**. The list shows every connection with its integration, type, and when it last linked. Check the counters to identify **Active**, **Incomplete** and **Relink Needed**.
List connectors and read `status` and `sync_status` off each one.
```bash theme={null}
curl --request GET \
--url 'https://api.bindbee.dev/api/hris/v1/connectors' \
--header 'Authorization: Bearer '
```
See [Get Connectors](/api-reference/connectors/get-connectors).
**Result:** You've identified the connector to investigate.
Select the connector and go to **Sync**. Each run lists its trigger, status, record and employee counts, and when it ends.
| Dashboard status | Meaning |
| -------------------- | --------------------------------- |
| Synced | Every in-scope model loaded |
| Partial | Some models loaded, others failed |
| A percentage (`41%`) | A sync is running |
| Failed | The run failed |
**Result:** You know which run to open.
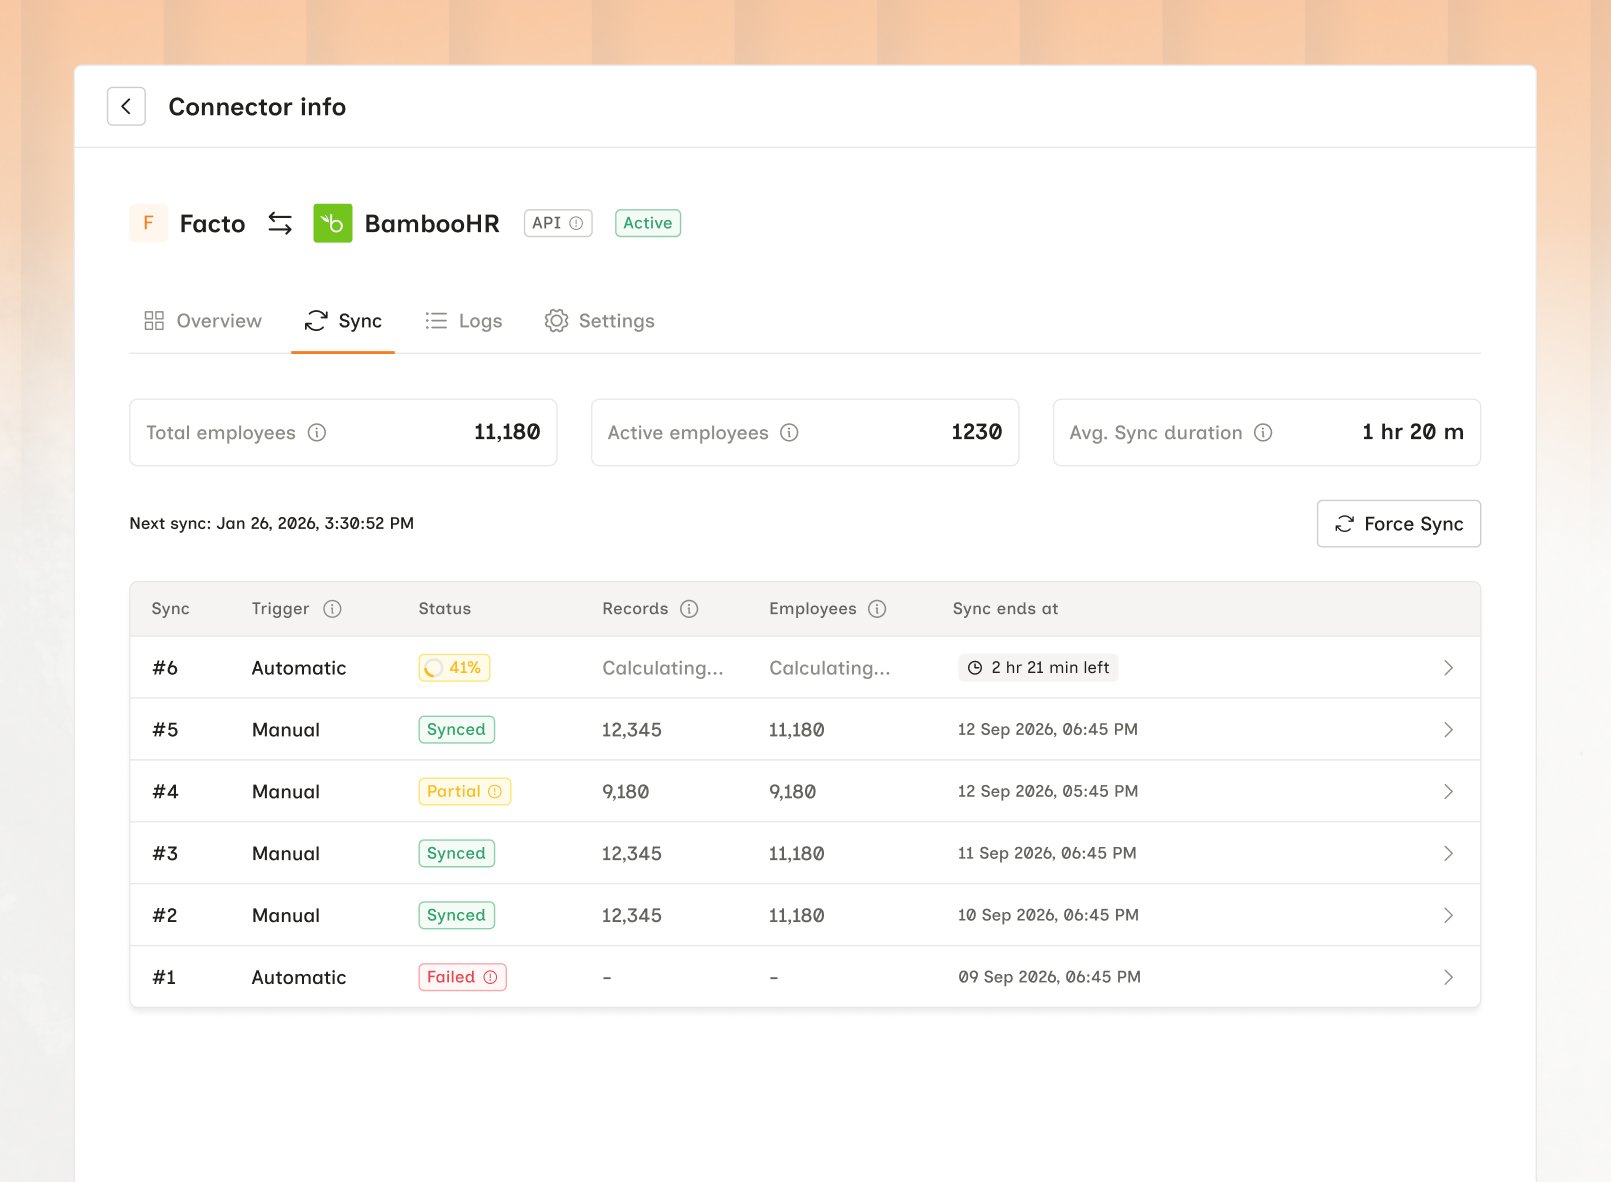 These are the dashboard's labels. The `sync_status` field carries a narrower set -
`Syncing`, `Done` or `Failed`. Code branching on a `Partial` will never match.
Click into a run to reach **Sync info**. The header carries the run's status and duration. Every model the connector covers is listed below with its record count, timings, and status.
| Model status | Meaning | What to do |
| ------------- | --------------------------------------------------------- | ----------------------------------------------------------------- |
| Synced | The model loaded | No action |
| Pending | Queued behind the models still running | Wait for the run to finish |
| Skipped | The model is switched off in scoping | Enable it in [scoping](/get-started/scoping) and resync |
| Not Supported | Bindbee doesn't unify this model for this integration yet | Ask Bindbee to prioritize it, where it's in beta |
| Failed | The model was attempted and errored | Expand the row, then see [Errors](/guides/troubleshooting/errors) |
**Result:** A status for every model. Synced, Skipped and Not Supported all end the investigation here, without reaching [Logs](/guides/troubleshooting/logs). Only Failed continues.
These are the dashboard's labels. The `sync_status` field carries a narrower set -
`Syncing`, `Done` or `Failed`. Code branching on a `Partial` will never match.
Click into a run to reach **Sync info**. The header carries the run's status and duration. Every model the connector covers is listed below with its record count, timings, and status.
| Model status | Meaning | What to do |
| ------------- | --------------------------------------------------------- | ----------------------------------------------------------------- |
| Synced | The model loaded | No action |
| Pending | Queued behind the models still running | Wait for the run to finish |
| Skipped | The model is switched off in scoping | Enable it in [scoping](/get-started/scoping) and resync |
| Not Supported | Bindbee doesn't unify this model for this integration yet | Ask Bindbee to prioritize it, where it's in beta |
| Failed | The model was attempted and errored | Expand the row, then see [Errors](/guides/troubleshooting/errors) |
**Result:** A status for every model. Synced, Skipped and Not Supported all end the investigation here, without reaching [Logs](/guides/troubleshooting/logs). Only Failed continues.
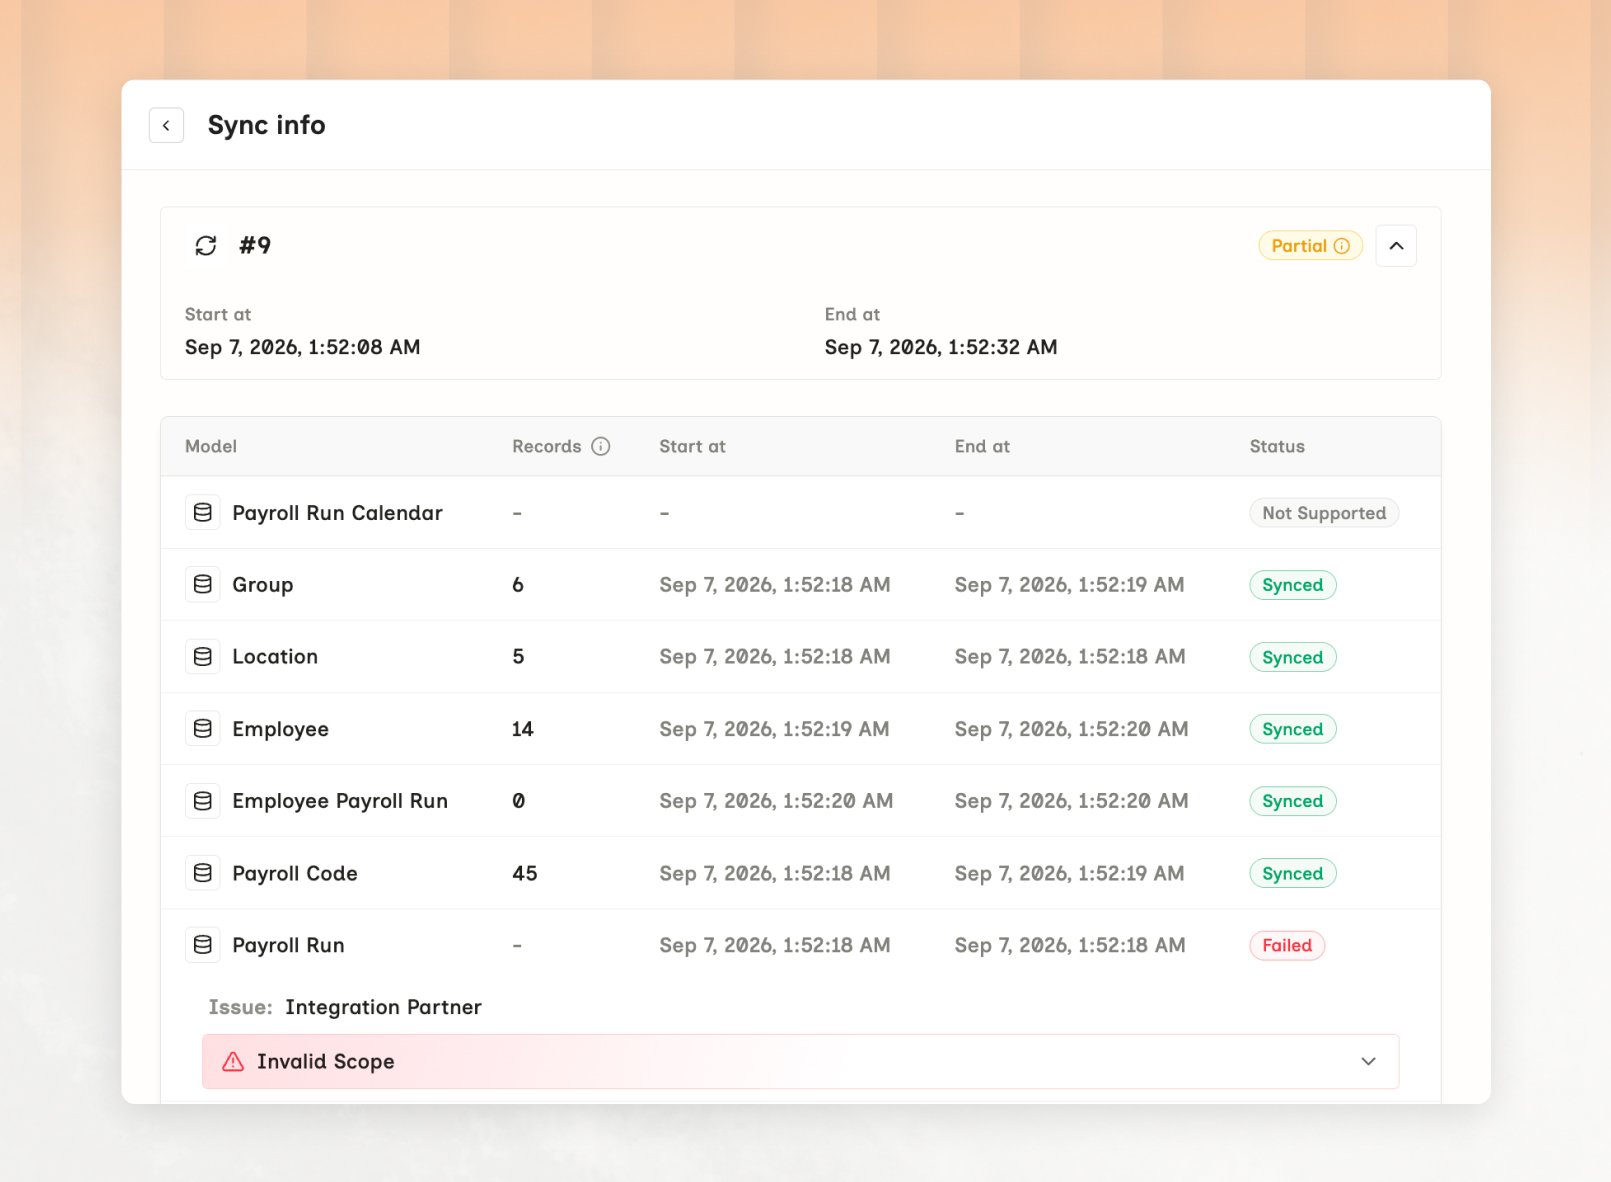 A **Failed** row expands in place to name the failure:
| Field | Holds |
| ------- | ------------------------------------------------------------------------------------ |
| Issue | Where the failure came from. **Integration Partner** means the source system refused |
| Message | The upstream response, verbatim |
Bindbee also flags a recognized cause above the detail - a permission refusal surfaces as **Permission issue found!**
In the run above, **Dependent** failed with `User not authorized.` against **Integration Partner** - a permission gap on the customer's side. See [Origin-system errors](/guides/troubleshooting/errors#origin-system-errors).
**Result:** You know whether to report it to Bindbee or take a permission back to the customer.
Compare the run's start time against the connector's configured cadence to work out when the next one is due.
**Result:** You know whether the data you're reading is current.
Development connectors have no recurring schedule. On one of those, the last sync is
its initial sync or the last one someone triggered - see [Syncing](/guides/reading-writing/syncing).
## Diagnose a partial sync
The connector is authenticated and running, so the failure is scoped to specific models. Note every model reporting **Failed**, then match the set against these patterns. The cause is usually shared across them.
| Pattern | Likely cause |
| ------------------------------------------- | ------------------------------------------------------------------------------------------------------------------------------- |
| One model family fails, such as all payroll | The credentials lack permission for that area - see [Origin-system errors](/guides/troubleshooting/errors#origin-system-errors) |
| A model fails only on large populations | Upstream request size or timeout limits. Retry below |
| Different models fail on different runs | Transient upstream errors or rate limiting. Retry below |
| Every model fails | Treat it as a failed sync - see [Connector relink](/guides/troubleshooting/connector-relink) |
### Retry the sync
For transient and size-related failures, trigger a fresh run. If the same models fail the same way afterwards, it isn't transient.
Click **Force Sync** on the connector's Overview tab. It grays out while a run is in progress, and on a connector needing re-authorization.
```bash theme={null}
curl --request POST \
--url 'https://api.bindbee.dev/api/embedded/v1/connectors/resync' \
--header 'Authorization: Bearer ' \
--header 'X-Connector-Token: '
```
See [Force Resync a Connector](/api-reference/connectors/resync-connector).
Resync. Do not delete and recreate. Deleting a connector discards its sync history and
record identities, which changes the IDs your system has stored.
## Monitoring this programmatically
Subscribe to webhook events instead of polling. `connector_sync_started`, `connector_synced` and `connector_sync_error` cover the states above. See [Choose Webhook Events](/guides/reading-writing/webhooks) for the catalog.
The per-model breakdown is dashboard-only. The connector endpoint returns a single
`sync_status` for the whole run, so these events are the only way to alert on one model.
## Frequently Asked Questions
Zero records, or records with empty fields. Either the model is out of scope, or the credentials lack permission for that endpoint - see [Origin-system errors](/guides/troubleshooting/errors#origin-system-errors) and [Missing records](/guides/troubleshooting/missing-records).
Development connectors don't auto-sync. On a Production connector this is a stall - see [Connector relink](/guides/troubleshooting/connector-relink).
Wait for it to finish. Duration scales with population size and with how many API calls the source system makes per record.
## Related
* [Errors](/guides/troubleshooting/errors) - the next step when a model reports **Failed**
* [Logs](/guides/troubleshooting/logs) - the last resort, once this and Errors haven't explained it
* [Syncing](/guides/reading-writing/syncing) - the schedule a status is measured against
A **Failed** row expands in place to name the failure:
| Field | Holds |
| ------- | ------------------------------------------------------------------------------------ |
| Issue | Where the failure came from. **Integration Partner** means the source system refused |
| Message | The upstream response, verbatim |
Bindbee also flags a recognized cause above the detail - a permission refusal surfaces as **Permission issue found!**
In the run above, **Dependent** failed with `User not authorized.` against **Integration Partner** - a permission gap on the customer's side. See [Origin-system errors](/guides/troubleshooting/errors#origin-system-errors).
**Result:** You know whether to report it to Bindbee or take a permission back to the customer.
Compare the run's start time against the connector's configured cadence to work out when the next one is due.
**Result:** You know whether the data you're reading is current.
Development connectors have no recurring schedule. On one of those, the last sync is
its initial sync or the last one someone triggered - see [Syncing](/guides/reading-writing/syncing).
## Diagnose a partial sync
The connector is authenticated and running, so the failure is scoped to specific models. Note every model reporting **Failed**, then match the set against these patterns. The cause is usually shared across them.
| Pattern | Likely cause |
| ------------------------------------------- | ------------------------------------------------------------------------------------------------------------------------------- |
| One model family fails, such as all payroll | The credentials lack permission for that area - see [Origin-system errors](/guides/troubleshooting/errors#origin-system-errors) |
| A model fails only on large populations | Upstream request size or timeout limits. Retry below |
| Different models fail on different runs | Transient upstream errors or rate limiting. Retry below |
| Every model fails | Treat it as a failed sync - see [Connector relink](/guides/troubleshooting/connector-relink) |
### Retry the sync
For transient and size-related failures, trigger a fresh run. If the same models fail the same way afterwards, it isn't transient.
Click **Force Sync** on the connector's Overview tab. It grays out while a run is in progress, and on a connector needing re-authorization.
```bash theme={null}
curl --request POST \
--url 'https://api.bindbee.dev/api/embedded/v1/connectors/resync' \
--header 'Authorization: Bearer ' \
--header 'X-Connector-Token: '
```
See [Force Resync a Connector](/api-reference/connectors/resync-connector).
Resync. Do not delete and recreate. Deleting a connector discards its sync history and
record identities, which changes the IDs your system has stored.
## Monitoring this programmatically
Subscribe to webhook events instead of polling. `connector_sync_started`, `connector_synced` and `connector_sync_error` cover the states above. See [Choose Webhook Events](/guides/reading-writing/webhooks) for the catalog.
The per-model breakdown is dashboard-only. The connector endpoint returns a single
`sync_status` for the whole run, so these events are the only way to alert on one model.
## Frequently Asked Questions
Zero records, or records with empty fields. Either the model is out of scope, or the credentials lack permission for that endpoint - see [Origin-system errors](/guides/troubleshooting/errors#origin-system-errors) and [Missing records](/guides/troubleshooting/missing-records).
Development connectors don't auto-sync. On a Production connector this is a stall - see [Connector relink](/guides/troubleshooting/connector-relink).
Wait for it to finish. Duration scales with population size and with how many API calls the source system makes per record.
## Related
* [Errors](/guides/troubleshooting/errors) - the next step when a model reports **Failed**
* [Logs](/guides/troubleshooting/logs) - the last resort, once this and Errors haven't explained it
* [Syncing](/guides/reading-writing/syncing) - the schedule a status is measured against